Lorem ipsum dolor sit amet consectetur netus erat
Lorem ipsum dolor sit amet consectetur bibendum volutpat.

You're a sales manager who just invested in training for your team. Three weeks later, you get a report showing "85% completion rate" and call it a win. But then you notice your team is still struggling with the same customer objections they faced before the training.
Sound familiar? This is the gap between measuring training activity and measuring actual impact. The reality is that traditional completion metrics don't tell the full story.
Let's dive into how you can use a proven framework to move from data to actual decisions that improve your team's performance.
Back in the 1950s, Donald Kirkpatrick created a framework that's still the gold standard for measuring learning effectiveness. Let's walk through how it works in practice with a real scenario.
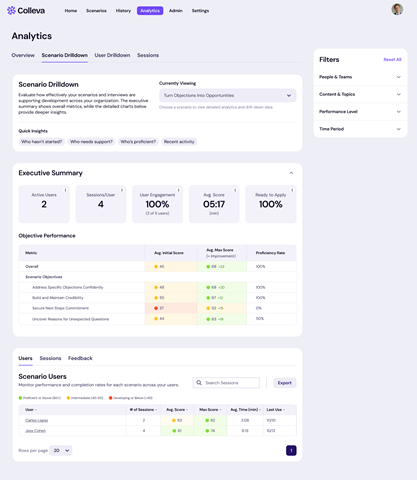
Going back to the sales team example, you assign three high-stakes sales scenarios to improve your team's performance with challenging customers:
You give them three weeks to complete all scenarios with a proficient score or above. Here's how you'd use the four-level framework to track progress and make decisions:
Traditional approach: Send out a survey asking "How did you like the training?"
Modern approach: Track meaningful engagement metrics in real-time.
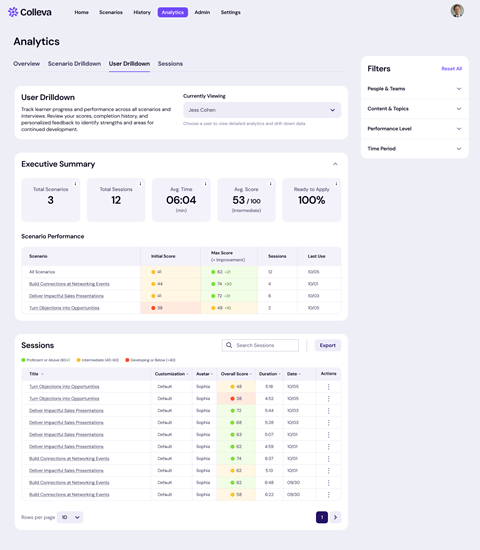
In the sales team example: Your week 1 check-in shows that Jess has gotten proficient scores in two scenarios, while Carlos has taken one scenario but didn’t pass yet.

In Colleva's dashboard, you can see:
What this tells you: If people aren't engaged, they won't learn. The engagement data shows you which scenarios resonate, and which team members might need encouragement.
Action you can take: Send Carlos a quick check-in to see if you can support his progress.
Traditional approach: Multiple choice quiz at the end of a course.
Modern approach: Performance-based scoring on realistic simulations of high-stakes interactions.
In the sales team example: Jess scored well on building rapport but struggled with objection handling techniques. The AI feedback shows she's great at asking discovery questions but tends to give in instead of addressing concerns directly.
Colleva's AI evaluates how well people perform against specific learning objectives in realistic simulations with prospects and customers. For sales teams, we offer scenarios that walk through key steps of the sales process—engaging a prospect, presenting your product, handling objections, and closing the deal. These aren't role-plays with colleagues; they're AI-powered simulations that feel like real customer interactions.
What this tells you: You can see exactly which skills people are mastering and which ones need more work, down to specific behaviors within each interaction.
Action you can take: Schedule a quick coaching session with Jess about objection handling. Share specific techniques for addressing price concerns without immediately offering discounts.
This is where most training programs fail. People might ace the quiz but never use the skills when it matters.
In the sales team example:
Action: Use this data to guide your next team meeting and individual coaching conversations. Instead of generic sales tips, you can give specific, personalized feedback: "I noticed you're doing great with rapport-building, but when prospects bring up budget concerns, you tend to move straight to price instead of exploring what's driving their concern."
The ultimate question: Is your training investment paying off in ways that matter to the organization?
Traditional approach: Hope for the best and maybe check overall performance metrics months later.
Modern approach: Connect training data to business outcomes through multiple data points.
In the sales team example: Follow up with an Employee Insights interview to gather feedback about how the training is impacting day-to-day work. Are your sales reps using the techniques they learned? Are they feeling more confident in challenging situations? Are prospects responding differently?
Colleva also provides Employee Insights interviews that can function as:
Action you can take: Make data-driven decisions about which scenarios to expand, modify, or discontinue based on real business impact.
Traditional training analytics give you reports to file away. Modern learning analytics give you insights that drive coaching conversations.
The goal isn't just better measurement—it's better decisions that help your people grow and your organization succeed.
Ready to see how robust learning analytics can transform your L&D strategy? Learn more about Colleva's offerings or schedule a demo to see it in action.
Lorem ipsum dolor sit amet consectetur. Lectus ac eleifend in convallis imperdiet. Amet tortor lorem odio proin dolor. Convallis dolor posuere vitae pellentesque nulla rutrum sit. Quam aliquet a arcu iaculis sit fringilla eu. Tortor tortor amet nunc non odio posuere convallis ut. Massa risus orci enim arcu. Sit platea pharetra purus aliquet proin. Ac gravida id sit odio. Tempor posuere tellus iaculis in enim scelerisque non amet id. Egestas nisl risus placerat quis euismod hendrerit ac. Condimentum at quam nunc adipiscing urna facilisi leo. Turpis senectus posuere laoreet tellus hendrerit faucibus platea blandit sed. Nibh feugiat felis felis sem urna volutpat eget turpis amet. Lorem auctor egestas diam imperdiet.
Felis venenatis mi varius ac nunc mi neque rhoncus. A nullam turpis laoreet odio cras mauris nulla auctor. Vel maecenas facilisis congue ultrices mauris justo fames a platea. Etiam eget nascetur nibh vitae. Eu accumsan mus dolor tristique.
Lorem ipsum dolor sit amet consectetur. Lectus ac eleifend in convallis imperdiet. Amet tortor lorem odio proin dolor. Convallis dolor posuere vitae pellentesque nulla rutrum sit. Quam aliquet a arcu iaculis sit fringilla eu. Tortor tortor amet nunc non odio posuere convallis ut. Massa risus orci enim arcu. Sit platea pharetra purus aliquet proin. Ac gravida id sit odio. Tempor posuere tellus iaculis in enim scelerisque non amet id. Egestas nisl risus placerat quis euismod hendrerit ac. Condimentum at quam nunc adipiscing urna facilisi leo. Turpis senectus posuere laoreet tellus hendrerit faucibus platea blandit sed. Nibh feugiat felis felis sem urna volutpat eget turpis amet. Lorem auctor egestas diam imperdiet.

Lorem ipsum dolor sit amet consectetur. Lectus ac eleifend in convallis imperdiet. Amet tortor lorem odio proin dolor. Convallis dolor posuere vitae pellentesque nulla rutrum sit. Quam aliquet a arcu iaculis sit fringilla eu. Tortor tortor amet nunc non odio posuere convallis ut. Massa risus orci enim arcu. Sit platea pharetra purus aliquet proin. Ac gravida id sit odio. Tempor posuere tellus iaculis in enim scelerisque non amet id. Egestas nisl risus placerat quis euismod hendrerit ac. Condimentum at quam nunc adipiscing urna facilisi leo. Turpis senectus posuere laoreet tellus hendrerit faucibus platea blandit sed. Nibh feugiat felis felis sem urna volutpat eget turpis amet. Lorem auctor egestas diam imperdiet.
Lorem ipsum dolor sit amet consectetur. Lectus ac eleifend in convallis imperdiet. Amet tortor lorem odio proin dolor. Convallis dolor posuere vitae pellentesque nulla rutrum sit. Quam aliquet a arcu iaculis sit fringilla eu. Tortor tortor amet nunc non odio posuere convallis ut. Massa risus orci enim arcu. Sit platea pharetra purus
Lorem ipsum dolor sit amet consectetur. Lectus ac eleifend in convallis imperdiet. Amet tortor lorem odio proin dolor. Convallis dolor posuere vitae pellentesque nulla rutrum sit. Quam aliquet a arcu iaculis sit fringilla eu. Tortor tortor amet nunc non.
Lorem ipsum dolor sit amet consectetur. Lectus ac eleifend in convallis imperdiet. Amet tortor lorem odio proin dolor. Convallis dolor posuere vitae pellentesque.
Lorem ipsum dolor sit amet consectetur. Lectus ac eleifend in convallis imperdiet. Amet tortor lorem odio proin dolor. Convallis dolor posuere vitae pellentesque nulla rutrum sit. Quam aliquet a arcu iaculis sit fringilla eu. Tortor tortor amet nunc non odio posuere convallis ut. Massa risus orci enim arcu. Sit platea pharetra purus aliquet proin. Ac gravida id sit odio. Tempor posuere tellus iaculis in enim scelerisque non amet id. Egestas nisl risus placerat quis euismod hendrerit ac. Condimentum at quam nunc adipiscing urna facilisi leo. Turpis senectus posuere laoreet tellus hendrerit faucibus platea blandit sed. Nibh feugiat felis felis sem urna volutpat eget turpis amet. Lorem auctor egestas diam imperdiet.

Lorem ipsum dolor sit amet consectetur bibendum volutpat.
Lorem ipsum dolor sit amet consectetur bibendum volutpat.
Lorem ipsum dolor sit amet consectetur bibendum volutpat.

AI adoption plateaus when the humans working alongside it lack the skills to do their part. The tool is only as valuable as the human wielding it.

Deloitte's 2026 research shows human-centric AI approaches outperform. Here's what that means for L&D investment.

Research shows AI brain fry is real, and HR is among the hardest-hit functions.